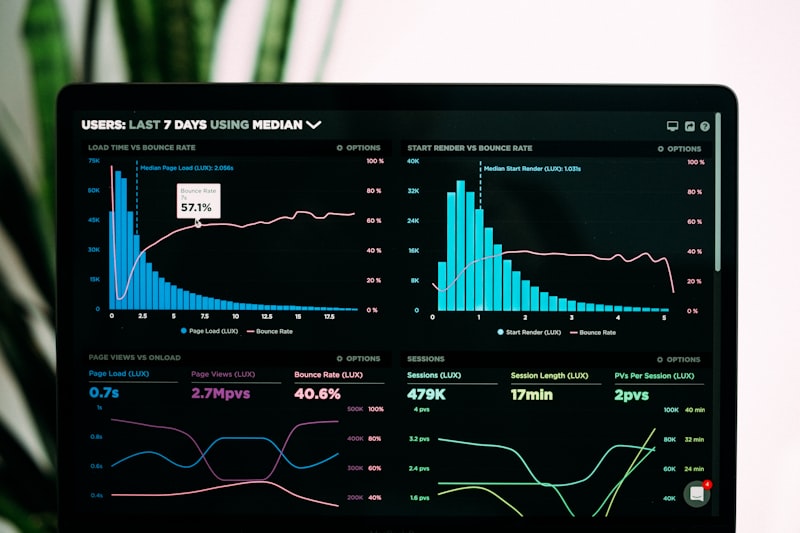
Why Fast Monitoring Dashboards Are a Business Requirement
During a production incident, every second counts. If your uptime monitoring dashboard needs half a minute to load graphs and screenshots, your team is starting each investigation already behind. The performance of your monitoring tools directly affects your Mean Time To Resolution (MTTR), and therefore your real‑world downtime and SLA posture.
That's why we designed our dashboard to behave like a high‑performance application, not a slow back‑office report. Key optimizations include:
- Thumbnail‑based screenshots that keep the first page light, loading full HD images only when you open the preview.
- Pre‑aggregated uptime and response‑time metrics for the last 1, 7, and 30 days, so charts render instantly instead of crunching millions of raw checks on every view.
- Efficient response timelines that focus on the most recent, most relevant checks for quick troubleshooting.
On top of this, we continuously monitor our own monitoring APIs, tracking response times per endpoint and per route. When we see regressions, we fix them before they impact your incident workflow. A fast monitoring dashboard isn't just a UX nicety—it's a serious business requirement for any company that relies on high website uptime and strong SEO, because slow incident response quickly turns into lost revenue and unhappy users.